Can a real-time dashboard help monitor production line output and identify slowdowns immediately?
The world of making things hums with a steady rhythm. In a busy factory, machines spin and whir. Parts move along, turning into finished goods. For a long time, watching over this dance meant people walking around, clipboard in hand, noting down numbers. They would look at how many items were made, how fast, and if anything seemed stuck. But this way of watching had a hidden problem: by the time you saw a problem, it might have already grown quite big.
A simple truth about making things is that time is precious. Every minute a machine sits idle, or a process slows down, means fewer good things are made. It means money lost. It means customers waiting longer. Imagine a river flowing. If a big rock suddenly blocks part of it, the water slows down. It backs up. If you don’t spot that rock right away, the whole river system gets messed up. Factories are a bit like that river. They need to flow freely.
This is where a real-time dashboard steps onto the stage. It’s not just a fancy screen. It’s like having a special pair of eyes that see everything happening on the factory floor right now. Not yesterday. Not an hour ago. But this very second. This immediate view helps people understand what is going on, making sure the making keeps going smoothly.
The Unblinking Eye of the Factory Floor: How Real-Time Dashboards Spot Trouble Instantly
A real-time dashboard is like the control panel in an airplane, but for a factory. It shows dials, graphs, and numbers that are always changing, always up-to-date. Think of it as a giant, smart window into every little part of the production line. It gathers information from machines, sensors, and even people’s actions, all at the same time. Then, it puts all that information into easy-to-understand pictures and numbers on a screen.
What does “real-time” really mean here? It means that when something happens, the dashboard knows it almost instantly. If a machine hiccups, the dashboard shows it. If parts stop flowing, the dashboard warns you. It’s not about looking at last month’s report. It’s about seeing the pulse of the factory as it beats.
Before these smart dashboards, factory managers might wait until the end of the day, or even the end of the week, to look at reports. By then, a slowdown that started this morning could have cost a lot of time and money. It’s like waiting for the mail to find out your car ran out of gas an hour ago. Not very helpful, is it?
How These Clever Dashboards Work Their Magic
At its heart, a real-time dashboard is a storyteller. But instead of words, it uses data.
- Sensors Everywhere: Imagine tiny microphones, cameras, and thermometers attached to every machine. These are sensors. They are constantly listening, watching, and feeling what’s happening. A sensor might tell you the temperature of a machine, how many times a robotic arm moves, or if a piece of material is in the right spot.
- Machines Talking: Modern machines are smart. They can “talk” to each other and to a central computer system. They send messages like “I just finished a part!” or “My motor is getting hot!”
- The Brain in the Back: All these messages, from sensors and machines, go to a central “brain.” This brain is a powerful computer system. It quickly sorts through all the information, making sense of it. It knows what numbers are good and what numbers mean trouble.
- Seeing the Story: Finally, the sorted information is shown on the dashboard screen. It might be a green light if things are fine, or a flashing red light if there’s a problem. There might be graphs showing how many items are made per hour, or how much energy is being used. It’s designed so that a person can glance at it and immediately understand the story.
Think of it like a conductor leading a big orchestra. The conductor doesn’t wait for a report on how each musician played. The conductor hears the music as it happens. If a trumpet player misses a note, the conductor knows right away and can help fix it. A real-time dashboard acts like that conductor for the factory.
The Power of “Right Now”: Why Instant Feedback Matters
The biggest advantage of a real-time dashboard is its immediacy. It turns “I wonder what’s going on?” into “I know exactly what’s going on!”
Consider a busy baking factory, making thousands of cookies every hour. The dough is mixed, shaped, baked, and packaged.
- Before Dashboards: A machine that presses cookie shapes suddenly breaks down. Nobody notices for 15 minutes because the person watching that section is helping elsewhere. For those 15 minutes, no cookies are being shaped. The ovens stay empty. The packaging line has nothing to do. A big pile of dough just sits there, waiting. This small delay can quickly lead to thousands of lost cookies.
- With Dashboards: The moment the shaping machine stops, a sensor immediately tells the dashboard. A big red alert flashes on the screen, perhaps even making a quiet chime sound. The team leader sees it instantly. They rush over, fix the machine, or call a technician. The downtime might be cut from 15 minutes to 2 minutes. That’s a huge saving.
This isn’t just about saving money. It’s about reducing stress, making work smoother, and ensuring promises to customers are kept. It turns a reactive world (fixing problems after they’ve grown) into a proactive one (spotting problems when they are small, or even before they happen).
Spotting the Slowdowns: Specific Examples in Action
What kinds of slowdowns can these dashboards catch? Almost anything that stops the steady flow.
- The Stuck Machine: This is the most obvious. A machine stops or jams. The dashboard immediately shows “Line 3: Machine 7 – Stopped.”
- The Empty Bin: A machine needs raw materials to work. If the supply bin for those materials runs empty, the machine can’t do its job. A sensor in the bin tells the dashboard: “Material A: Low on Line 2.” This lets someone refill it before the machine has to stop.
- The Slow Worker: Sometimes, a certain part of the line might be running slower than the others, perhaps because a new worker is learning, or a tool isn’t quite right. The dashboard can show the output rate for each section. If one section shows a lower number, it’s a clear signal to investigate. “Section 4: Output below target.”
- The Quality Glitch: It’s not just about speed. What if a machine is making bad parts? A vision sensor might detect a faulty product. The dashboard can show “Line 1: High defect rate,” stopping the problem before hundreds of bad items are made.
- The Bottleneck: Imagine a road with many lanes suddenly narrowing to one. That’s a bottleneck. In a factory, it means one step in the process is slower than all the others, causing things to pile up before it and creating empty spaces after it. The dashboard can highlight this “traffic jam” by showing where items are waiting too long or where the next step isn’t getting enough parts.
When these alerts pop up, it’s like the dashboard is shouting, “Hey, look here! Something needs your attention!” This lets factory teams jump into action. They can fix small issues before they become big, costly headaches. The steady hum of the factory can continue without interruption, like a well-oiled machine.
BeyondRecommended Resources on AmazonSlowdowns: A Deeper Look at What Dashboards Reveal
These powerful tools do more than just point out a halt in production. They paint a much broader picture of how things are truly running.
- Energy Use: How much power are machines using? Is a particular machine suddenly using too much, hinting at a problem? The dashboard can show this, helping save electricity.
- Waste: Are we making too much scrap material? The dashboard can track waste numbers. If they spike, it flags a problem in the process or with the raw materials.
- Machine Health: Just like a car dashboard warns you about low oil or engine trouble, a factory dashboard can show the “health” of each machine. It might track vibrations, temperatures, or pressure. If a machine starts showing signs of trouble, workers can service it before it breaks down completely. This is called “predictive maintenance”—fixing something before it goes wrong, rather than after.
- Team Performance: While it’s important not to use this to spy on workers, a dashboard can show overall team productivity for a section. If a team is consistently hitting targets, it can be celebrated. If they’re struggling, it might mean they need more training or better tools, not that they are bad workers. It focuses on the process, not just the person.
This detailed view helps leaders make smart decisions. It’s not guesswork; it’s based on clear, up-to-the-second facts.
The Human Touch: Empowering People, Not Replacing Them
Some might wonder if these smart dashboards will take away jobs. But history shows us a different story. New tools often change jobs, making them safer, smarter, and more interesting.
Think about a farmer before the tractor. Their job was incredibly hard, pulling plows, working with animals. The tractor didn’t make farming disappear; it made it more efficient. Farmers could grow more food, with less back-breaking labor.
In the factory, real-time dashboards don’t replace the human worker. They empower them.
- Faster Decisions: Instead of waiting for a weekly meeting, a supervisor can make decisions in minutes.
- Problem Solvers: Workers on the floor become true problem-solvers. When an alert pops up, they’re not just fixing; they’re diagnosing. “Why did this happen? What’s the root cause?”
- Less Stress: Knowing what’s happening reduces stress. There’s less frantic searching for problems, more calm, informed action.
- New Skills: People learn new skills: how to read the dashboard, how to respond to alerts, how to work with smart machines. It raises the level of work.
The relationship between humans and these dashboards is a partnership. The machines gather data with tireless precision. Humans interpret that data, apply their wisdom, and make creative decisions that machines cannot. A human can see a subtle pattern the machine missed, or understand a situation that data alone cannot explain. They can empathize, innovate, and adapt in ways that no code can replicate.
A Glimpse into History: From Clipboards to Connectivity
It’s helpful to remember how far we’ve come. For centuries, factories were managed by people walking around, looking at physical machines. Workers recorded numbers on paper, which then had to be collected, typed into computers, and analyzed. This was slow. It was often too late to catch a problem quickly.
Even when computers first came into factories, they often just stored information. They didn’t show it live. It was like putting all your books in a library but having no quick way to find what you needed.
The shift to real-time dashboards is a huge leap. It’s like changing from looking at old photographs to watching a live video stream. This change wasn’t sudden. It grew slowly, with better sensors, faster internet, and smarter computer programs. It builds on the wisdom of how things were always done—watching, understanding, improving—but adds a powerful new layer of sight and speed.
Peering into Tomorrow: What Comes Next for Smart Factories?
If today’s dashboards are impressive, what does the future hold? The answer is: even smarter, more intuitive systems.
- AI as the Co-Pilot: Artificial intelligence (AI) will work even more closely with dashboards. AI can look at millions of pieces of data much faster than any human. It could not only spot a slowdown but also predict when a machine might break down. Imagine the dashboard saying, “This machine will likely need maintenance in three days, based on its vibration patterns.” This allows for truly proactive care.
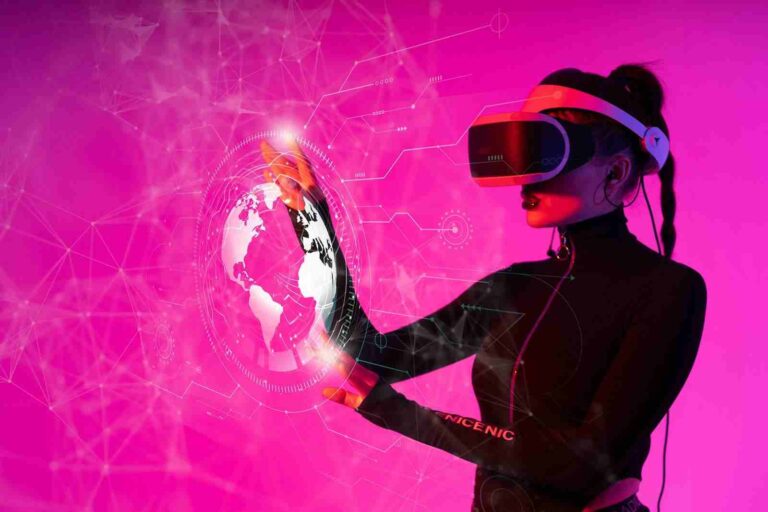
- Virtual Windows: Imagine wearing special glasses that let you see the dashboard data floating in the air above a machine. You could walk around the factory, and data points would appear right where you need them, without looking at a screen far away.
- Self-Healing Systems: In the far future, some machines might even fix themselves for small issues, or automatically adjust their settings to avoid problems, all guided by the real-time data they collect. The dashboard would still tell you what happened, but the problem might be solved before you even notice.
This push towards even more advanced monitoring speaks to a deep human desire: to master our environment, to create things with ever greater precision and less waste. It’s about building a future where work is more about thinking and solving, and less about repetitive, error-prone tasks.
The Philosophy of Flow: Beyond Numbers and Machines
The discussion of real-time dashboards, while technical, touches on deeper ideas. What does it mean for us when machines can monitor and react so quickly?
It forces us to think about the nature of our work. If machines handle the constant watching, what is left for the human spirit? Perhaps it is the art of improvement, the joy of creation, the wisdom of leadership. It allows us to step back from the frantic pace and ask bigger questions: How can we make things even better? How can we innovate? How can we create products that truly serve people?
A factory running smoothly with a real-time dashboard is not just efficient; it’s a testament to human ingenuity. It shows how we take complex problems and build elegant solutions. It’s about more than just making widgets; it’s about the dance between human intelligence and machine precision, working together to achieve a shared goal. The hum of a productive factory becomes a song of progress, where every note is in its place, and any discord is swiftly corrected.
We learn that the most valuable thing isn’t just speed, but clarity. It’s the ability to see things as they are, without delay, without distortion. This clarity allows for action. It transforms uncertainty into understanding. And in a world that is always moving, understanding is the most powerful tool we possess.
The Clear View: Insights and Outcomes
The journey from manual checks to sophisticated real-time dashboards is a story of continuous improvement. These dashboards are not just technological marvels; they are practical tools that profoundly change how factories operate. They are the unblinking eye, the constant monitor, the early warning system that every production line needs.
Key Takeaways:
- Instant Visibility: Real-time dashboards provide an immediate, up-to-the-second view of production line performance.
- Early Problem Detection: They identify slowdowns, machine failures, material shortages, and quality issues the moment they occur.
- Empowered Decisions: Workers and managers can make faster, more informed decisions, minimizing downtime and waste.
- Beyond Simple Monitoring: These tools offer insights into energy use, machine health, and overall efficiency, allowing for proactive maintenance and improvement.
- Human-Machine Partnership: Dashboards enhance human capabilities, freeing people to focus on problem-solving, innovation, and strategic thinking rather than constant, manual checks.
In the steady, ceaseless world of manufacturing, every second counts. With real-time dashboards, factories can move from simply making things to masterfully orchestrating their creation, ensuring a smooth, productive hum that benefits everyone. The future of making things is bright, clear, and very, very fast.