Can an SSRS report help manage student grades and academic progress in schools?
The School’s New Compass: Navigating Learning with Smart Reports
Imagine a time when all student grades were written by hand. Pages and pages of numbers, carefully penned, then added up with a soft pencil. Teachers would spend hours, their eyes scanning rows and columns, trying to find patterns. It was a tough job, and sometimes, a student’s struggles might have been missed in all that ink. The bell would ring, a rustle of paper would follow, and the school day would end, leaving behind a mountain of records.
But what if there was a magic compass, a tool that could instantly show a student’s path, highlighting where they soared and where they stumbled? What if this compass could help schools see the whole picture, not just bits and pieces? This isn’t magic, not really. It is about using smart tools, like a special kind of report writer, to make school better for everyone. These tools help turn plain numbers into clear pictures, making sure no student gets lost along the way.
What is a “Super Report Maker” Anyway?
Sometimes, big computer terms can sound a bit scary, like whispers from a hidden cave. “SSRS” is one of those terms. It stands for SQL Server Reporting Services. But let’s not get tangled in those big words. Think of it more simply: it’s like a super-smart artist who takes all the little pieces of information—like your test scores, how often you come to class, or how well you did on a project—and paints a clear, colorful picture.
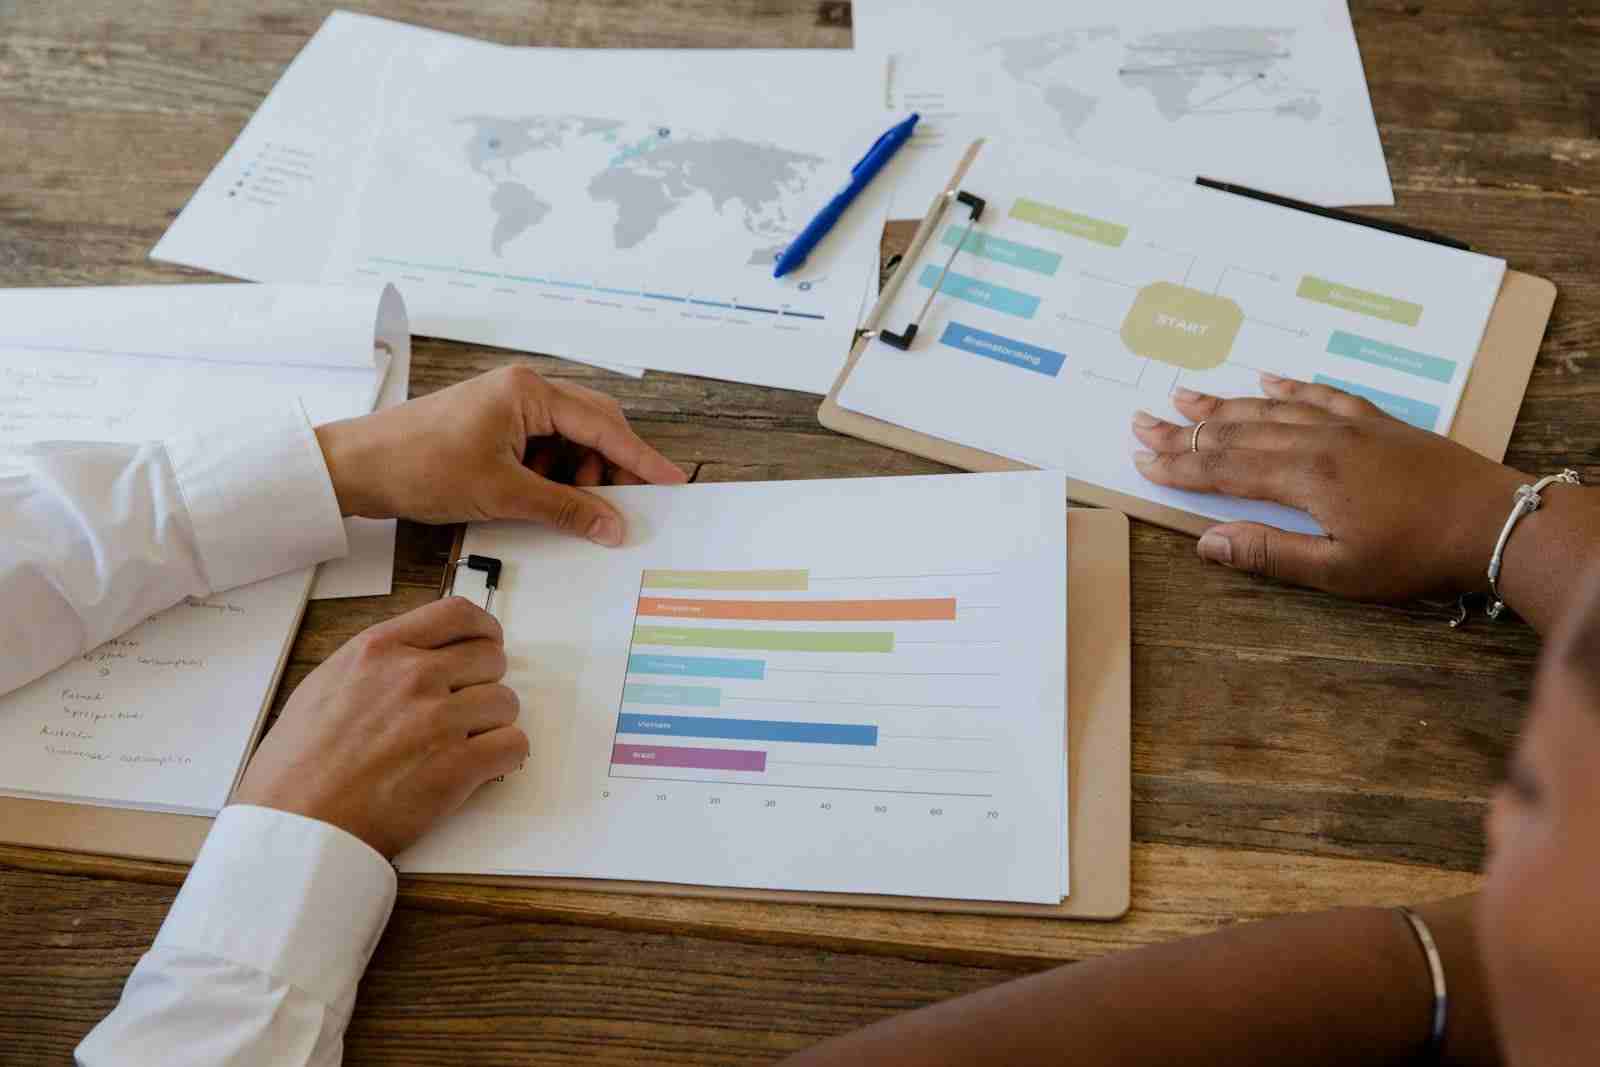
This artist doesn’t just show a jumble of numbers. No, this artist creates easy-to-read charts, graphs, and tables. Imagine a bar graph showing how much a student’s math scores grew over the year. Or a pie chart that explains how many students are doing great in reading compared to those who need a little extra help. This “super report maker” takes data, which is just a fancy word for information, and makes it make sense. It’s like turning a giant puzzle into a map.
The real trick is how it helps. It pulls information from all corners of the school’s digital brain. It then puts it together in a way that teachers, principals, and even parents can understand in a flash. It’s about seeing the forest and the trees at the same time. This kind of report isn’t just a paper showing numbers; it’s a window into how learning is happening.
From Quill and Ink to Quick Clicks: A Journey Through School Records
Long, long ago, schools kept records in big, heavy books. Think of dusty ledgers filled with neat handwriting, often kept by teachers who knew every student’s family story. Grades were written down, attendance was marked with a tiny “x” or a simple line. If a parent wanted to know how their child was doing, they might have to wait for a special meeting, perhaps over a cup of tea in the principal’s office, the air thick with the smell of old paper.
These handwritten records, while full of human care, were like looking through a tiny keyhole. It was hard to see the big picture. How many students struggled with fractions across the whole school? How many improved their reading over five years? These questions were like trying to count stars in the daytime. It simply wasn’t easy to connect all the dots.
Then came the age of computers. First, simple lists, then spreadsheets, like giant digital grids. These were faster, certainly. But they still often felt like wading through a sea of numbers. The “super report makers” came later, bringing with them a promise of clarity. They learned to speak the language of numbers and turn it into the language of understanding. They didn’t replace the human touch, but instead, helped sharpen the human eye. They brought the light of understanding to what was once a dim corner.
The Teacher’s Secret Helper: How Smart Reports Lend a Hand
Imagine being a teacher. You have twenty-five students, each with their own unique way of learning. Some catch on quickly, others need a bit more time. Some love history, while math makes their brow furrow. How do you keep track of everyone, all at once? It’s a bit like juggling many colorful balls in the air.
This is where the “super report maker” steps in as a quiet, steady helper. Teachers can look at a report and see, in moments, who is falling behind in spelling. They might spot that many students are having trouble with a specific type of word problem in math. Instead of guessing, or waiting for a big test to find out, the report shows them clearly, like a beam of light in a dim room.
This means teachers can change their plans faster. If the report shows that half the class is confused about a science topic, the teacher can decide to review it again, using a different approach. Or, if a student like Emily is suddenly doing worse in art, the teacher might check if something is going on, maybe a small chat could help. It helps teachers tailor lessons, like making custom-fit clothes for each student, ensuring that everyone gets the right kind of help at the right time.
It also helps teachers track growth. When a student like Kenji works hard and his scores slowly climb, the report can show that progress clearly. It’s not just about a final grade; it’s about the journey. This helps teachers celebrate small wins and encourage continued effort. It helps them see the true story of learning, not just the ending.
A Helping Hand for Students: Personalized Paths to Learning
Think about how it feels to try your best, but still feel stuck. Sometimes, students don’t even know why they’re stuck. A “super report maker” can help students, too, though they might not directly look at the detailed reports themselves.
How? Because the reports help teachers understand their learning. If a report shows that William struggles with reading long stories but excels at reading short poems, the teacher can give him more short poems to build his confidence, while also finding new ways to help him with longer texts. It’s like a personalized map for his learning adventure.
It also helps students understand their own progress. When teachers use the information from these reports to give specific feedback, students can see what they need to work on. Instead of just “You got a B,” they might hear, “Your essay structure is much stronger, but let’s work on adding more vivid descriptive words.” This clear feedback, powered by the report’s insights, helps students become their own learning heroes. They learn to spot their own challenges and celebrate their own victories. The feeling of understanding your own path can be very empowering.
Connecting Homes and Classrooms: The Parent Partnership
School is a team effort. The student, the teacher, and the family are all on the same team. But sometimes, parents might feel a bit left out, especially if they only get report cards a few times a year. These cards show a snapshot, but not the whole moving picture.
“Super report makers” can change this. They can
This means parents don’t have to wait for parent-teacher night to know how things are going. They can be more involved, asking specific questions like, “The report showed you’re doing great in history. What did you learn about ancient civilizations?” or “It looks like science is a bit tricky right now. Can we look at it together?” It helps parents feel connected, like they’re right there in the classroom, even when they’re at home. This partnership, built on clear information, is key to a student’s success. It’s about building bridges, not walls, between home and school.
The Art and Science of Fairness: Grading with a Clear View
Fairness is a big deal in school. Every student wants to feel that their efforts are judged fairly, that everyone plays by the same rules. In the past, grades could sometimes feel a little bit like a mystery, especially if they were just one number at the end of a long term.
“Super report makers” bring a new level of clarity. Because they can pull in all sorts of data – not just test scores, but also participation, project completion, and even how much a student tries to improve – they help paint a more complete and honest picture. This makes grading more about the whole learning journey, not just one or two big moments.
For example, a teacher might see that Ling got a low score on a math test, but the report also shows she completed every practice assignment and tried all the extra credit. This comprehensive view helps the teacher understand why the score might be low (maybe just a bad day?), and allows them to consider the whole effort. It helps make sure that grades truly reflect effort and growth, not just performance on one single day. This helps build trust between students and teachers, knowing that the system tries its best to see the full story. It removes some of the shadows and brings light to the grading process.
Beyond the Numbers: Nurturing the Whole Child
It is easy to get caught up in numbers: grades, scores, percentages. But a student is more than just a collection of numbers. Each student is a person with feelings, dreams, and unique talents. This is a deeply important thought. Can a report, made by a machine, understand the whole person?
No, the report itself cannot. It doesn’t know the joy a student feels when they finally understand a tough concept, or the quiet sadness of a bad day. It doesn’t hear the laughter in the hallways or see the kindness shared between friends. But here’s the clever part: the reports are tools for people. They are like a strong magnifying glass, helping teachers and parents see more clearly, so they can then use their human wisdom, their understanding, and their empathy to help the student.
The report might show that a student, let’s call him Hiroshi, has suddenly started missing assignments. The report doesn’t know why. But the teacher, seeing this red flag, can then have a quiet chat with Hiroshi. Maybe he’s feeling overwhelmed, or maybe something difficult is happening at home. The report acts as an early warning system, allowing the human side of education—the caring, the listening, the guiding—to step in sooner. It is about using information to fuel human connection, not replace it. It allows us to keep our focus on the growth of the whole child, mind and heart.
Whispers of Tomorrow: What These Reports Could Become
The world of technology never stands still. The “super report makers” of today are impressive, but what about tomorrow? Imagine a future where these reports could do even more.
- Learning Buddies: Perhaps these reports could help create personalized “learning buddies” for students. If a report shows James is a visual learner who struggles with reading, the system could suggest specific videos or interactive games just for him.
- Skill Tracking: Beyond grades, reports might track specific skills. Did a student master teamwork in a group project? Did they show great problem-solving skills in a science experiment? These reports could highlight strengths that aren’t just about tests.
- Future Pathways: Imagine a report that, by seeing a student’s interests and strengths, gently suggests possible career paths or subjects they might enjoy in higher education. Not telling them what to do, but opening doors they might not have seen.
Of course, with all this power comes responsibility. Schools will need to think carefully about privacy—who gets to see what information? And they’ll need to remember that these tools are there to help humans, not to replace the deep, irreplaceable connections between teachers and students. The future holds promise, a dance between old wisdom and new tools.
The Human Touch in a Digital World
In the end, even the smartest report, even the most detailed graph, means nothing without the human heart that reads it. The gentle glow of a screen showing a student’s progress is just light and pixels. It’s the teacher who sees the flickering light of effort. It’s the parent who feels the warmth of pride. It’s the student who finds the courage to try again.
These reports are not just about numbers; they are about understanding stories. They are about guiding dreams. They are about making sure that every student has the best chance to learn, grow, and shine their brightest. The purpose of all this clever technology is to free up the human mind to do what it does best: to teach, to inspire, to care, and to truly connect. For without connection, even the smartest data is just cold, hard fact. It is the human touch that breathes life into the numbers, making them truly matter.
Summary & Key Takeaways
The journey of student learning is rich and complex. While in the past, tracking progress involved much manual effort, today’s “super report makers,” like SSRS, offer a clear window into how students are doing. They act as a vital compass, guiding the entire school community.
Key Takeaways:
- Clarity and Understanding: These smart reports turn complex student data into easy-to-understand pictures, helping everyone from teachers to parents see patterns and progress.
- Empowering Teachers: They help teachers quickly spot who needs help and what areas need more teaching, allowing for personalized lesson plans and support.
- Supporting Students: By giving teachers better insights, these reports indirectly help students get the specific help and guidance they need to succeed and grow.
- Strengthening Home-School Ties: Reports can keep parents better informed, fostering a strong partnership between home and school for student success.
- Fairness in Grading: They help create a more complete and fair view of a student’s effort and growth, looking beyond just test scores.
- Human-Centered Technology: While powerful, these tools are best used as aids for human care and wisdom, allowing teachers and parents to focus on nurturing the whole child, not just the numbers.
- A Bright Future: Tomorrow’s reports could offer even more personalized learning paths and skill tracking, but always with a focus on ethical use and the importance of human connection.